Assessing three-bet frequency patterns across stake tiers in no-limit Texas Hold'em cash games on licensed digital platforms
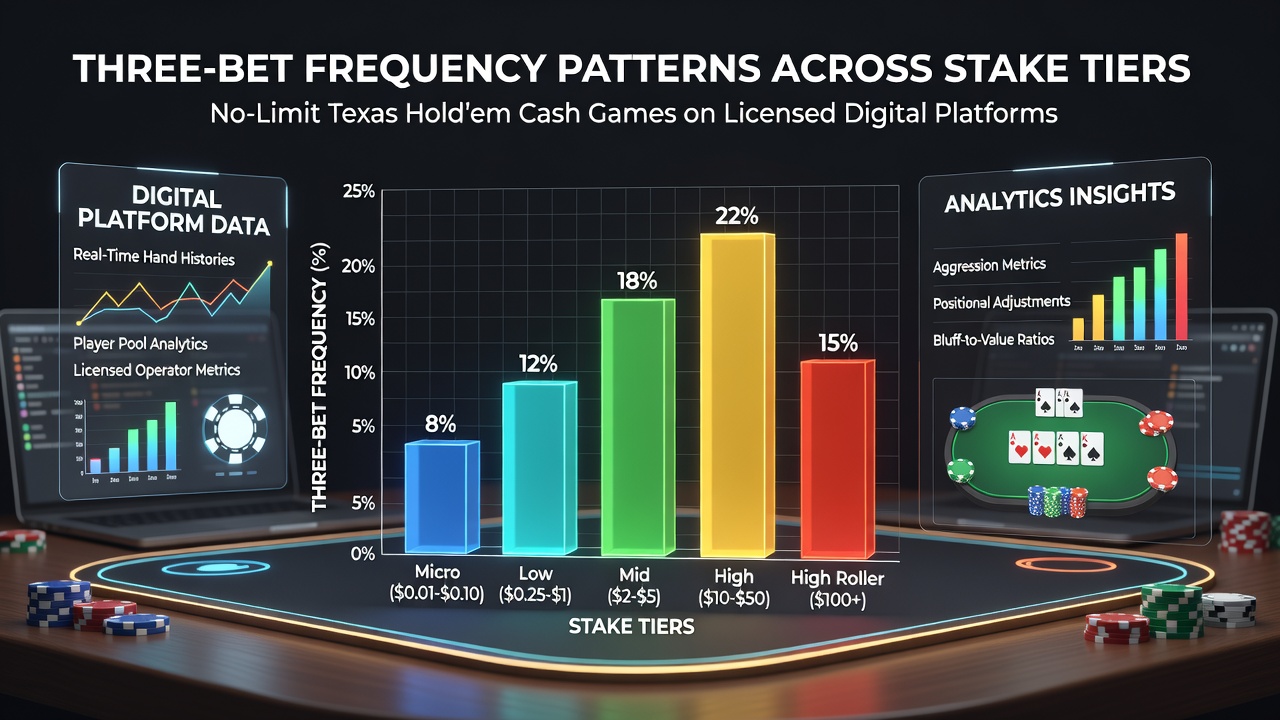
Three-bet frequencies in no-limit Texas Hold'em cash games on licensed digital platforms show measurable differences when tracked across stake tiers, and analysts compile these figures from hand history databases maintained by operators in regulated markets. Platforms record preflop actions at scale, which allows researchers to calculate how often players re-raise an initial raise, and the resulting percentages reveal consistent gradients rather than random variation. Data aggregated from multiple sites indicates that micro-stake pools often post lower three-bet rates, while mid and high-stake regulars demonstrate higher frequencies, although exact numbers shift with player pool composition and time of day.
Data collection methods on licensed platforms
Operators in jurisdictions such as New Jersey and Pennsylvania supply anonymized hand records to third-party analytics services, which then segment the data by blind level and format. These services apply standardized filters to isolate cash-game hands, removing tournament entries and sit-and-go results so that the three-bet metric reflects only ring-game play. Because each hand carries a timestamp and stake identifier, analysts can group results into tiers that range from 0.01/0.02 up through 5/10 and above, and the same methodology applies across different operators, which reduces platform-specific bias.
Observed frequencies by stake tier
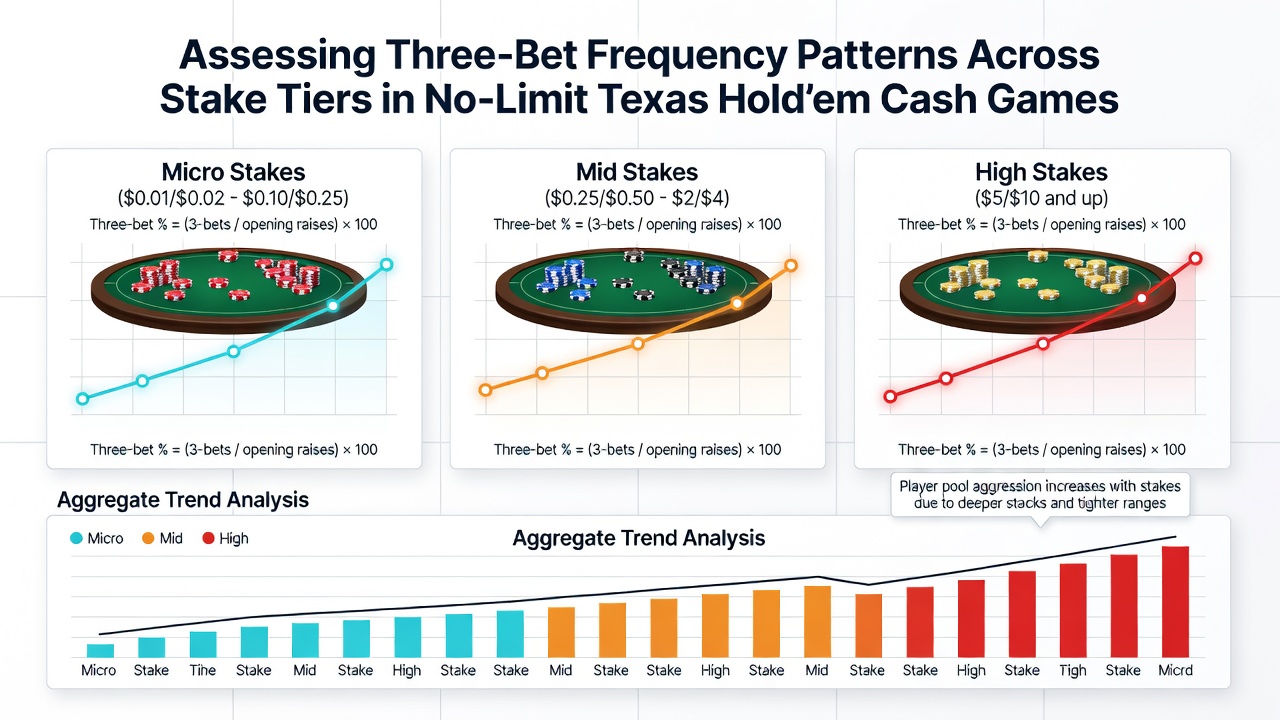
At the lowest stakes, three-bet frequencies typically sit between 4.8 and 6.2 percent according to multi-site samples collected through 2025 and into early 2026. Players at these levels tend to enter pots with wider ranges yet defend against three-bets at lower rates, which keeps overall three-bet volume modest. As stakes rise into the 0.25/0.50 and 0.50/1.00 brackets, the same datasets show an increase to 7.1–8.4 percent, and this uptick coincides with a larger proportion of regulars who construct tighter opening ranges yet apply more pressure when they do three-bet.
Mid-stakes from 1/2 through 2/4 display further elevation, with average three-bet percentages reaching 8.9–10.3 percent across several hundred thousand hands. Here the player pool contains more solvers users and coaching subscribers, and their ranges incorporate polarized three-betting strategies that balance value hands with selected bluffs. High-stakes sessions above 5/10 push the metric still higher, often landing between 11.5 and 13.8 percent, although sample sizes shrink and variance widens because fewer players occupy these games at any given hour.
Factors that influence the observed patterns
rake structures and deposit bonuses affect how recreational players approach three-bet spots, since higher rake at lower stakes reduces the profitability of marginal three-bets and encourages tighter defense. Meanwhile, high-stake regulars face lower relative rake and therefore gain more from aggressive lines that exploit weaker opening ranges. Time-of-day splits within the same datasets reveal modest but repeatable drops in three-bet frequency during late-night hours when recreational traffic increases and professional volume decreases.
Software tools that track real-time statistics allow regulars to adjust their three-bet ranges dynamically, and these adjustments appear more frequently at stakes where HUD usage is widespread. In contrast, micro-stake populations contain a higher share of mobile-only players who rely on default strategies rather than population reads, which contributes to the lower three-bet percentages recorded at those levels.
Regional regulatory context and platform differences
Licensed operators must comply with data-retention rules set by state gaming authorities, and these rules shape how hand histories become available for frequency studies. In markets overseen by the New Jersey Division of Gaming Enforcement, for instance, operators release aggregated reports that researchers can cross-reference with similar disclosures from the Pennsylvania Gaming Control Board. Such cross-jurisdictional comparisons show that three-bet frequencies remain broadly consistent once stake tier and player-pool demographics are controlled, although slight variations emerge around bonus-driven traffic spikes.
One state regulatory summary released in spring 2026 noted stable cash-game participation across mid-stakes, which aligns with the three-bet trends captured in private databases. A separate industry analysis from the European Gaming and Betting Association examined multi-state traffic patterns and found comparable aggression metrics once rake differences were normalized.
Conclusion
Three-bet frequency patterns across stake tiers in online no-limit Texas Hold'em therefore follow a clear upward trajectory as stakes increase, and the gradient persists across multiple licensed platforms when data collection methods remain consistent. Observers continue to monitor these metrics because shifts in player demographics or regulatory changes could alter the distributions, yet current figures supply a reliable baseline for anyone examining preflop dynamics on digital tables.